
Businesses are collecting more data than ever before — which is great as long as you can make sense of it. Unfortunately, many marketing, product and operations teams feel like they’re drowning in data.
A good data analytics platform can be a lifeline. Data analytics platforms collect, organise and visualise business data. They help teams uncover hidden patterns and take action to improve the customer experience and the company’s bottom line.
This article reviews five of the leading data analytics platforms in 2026 and walks through how to find the best solution for a specific use case.
What is a data analytics platform?
A data analytics platform helps teams collect, process, analyse and visualise large volumes of data. They often extract and integrate a wide variety of source data before consolidating in a centralised interface.
Marketing teams, for example, can use web analytics to better understand customer journeys. For example, multi-channel conversion attribution reports show how different touchpoints (like paid ads, email marketing and social media) contribute to an eventual conversion.
They also help marketers analyse engagement, attribute conversions, and identify areas for improvement.
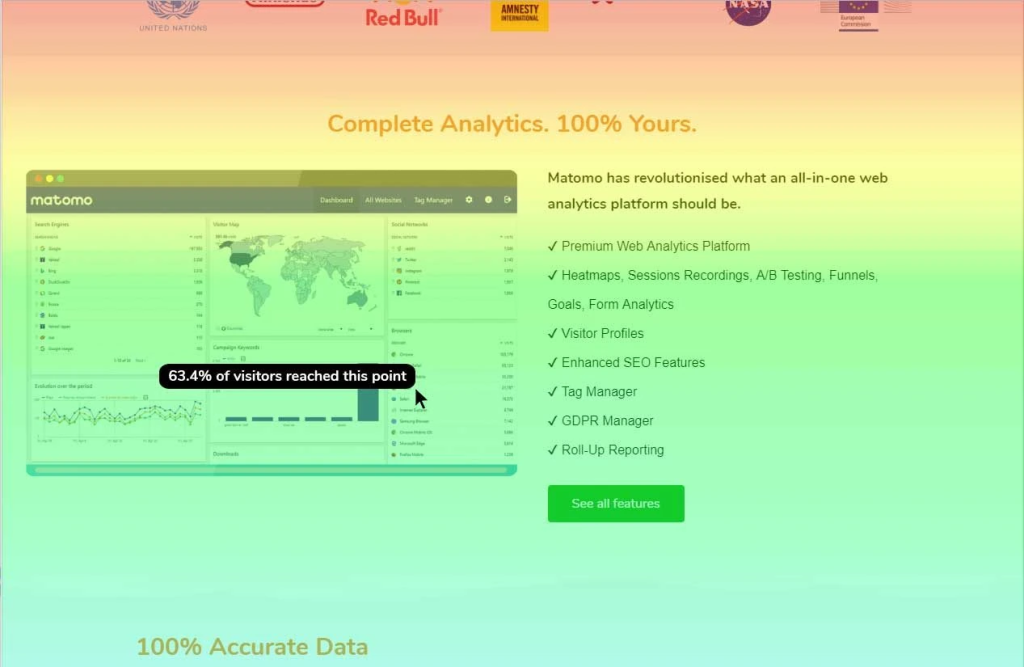
Matomo heatmap showing visitor scroll depth.
For instance, imagine running a campaign and the paid ads are generating plenty of traffic, but no one is converting.
Advanced analytics features, such as heatmaps and session recordings, can help troubleshoot the issue by showing teams what visitors see, or what they may not see. With those insights, it’s much easier to determine the problem, develop and implement a solution and monitor the result.
This example is just one of many use cases for a data analytics platform. Specific capabilities and functionalities vary by platform, as you’ll see in the next section.
The top data analytics platforms in 2026
Below, you’ll find detailed reviews of five of the leading data analytics platforms that highlight their capabilities, benefits, drawbacks and pricing.
| Best for | Primary users | Free users | |
| Matomo | Web analytics & user behaviour | Marketers, website owners, analysts | ✔ |
| Amplitude | Product analytics | Product managers, data analysts | Free starter plan (basic) |
| Microsoft Power BI | Business intelligence | Business analysts, data scientists | ✔ |
| Tableau | Data visualization | Business analysts, data scientists | – |
| Alteryx | Data preparation | Data analysts, data engineers | – |
1. Matomo
Best for: Privacy-centric web analytics
Matomo is an open-source analytics platform that takes a privacy-first approach to website data collection, analysis and reporting.
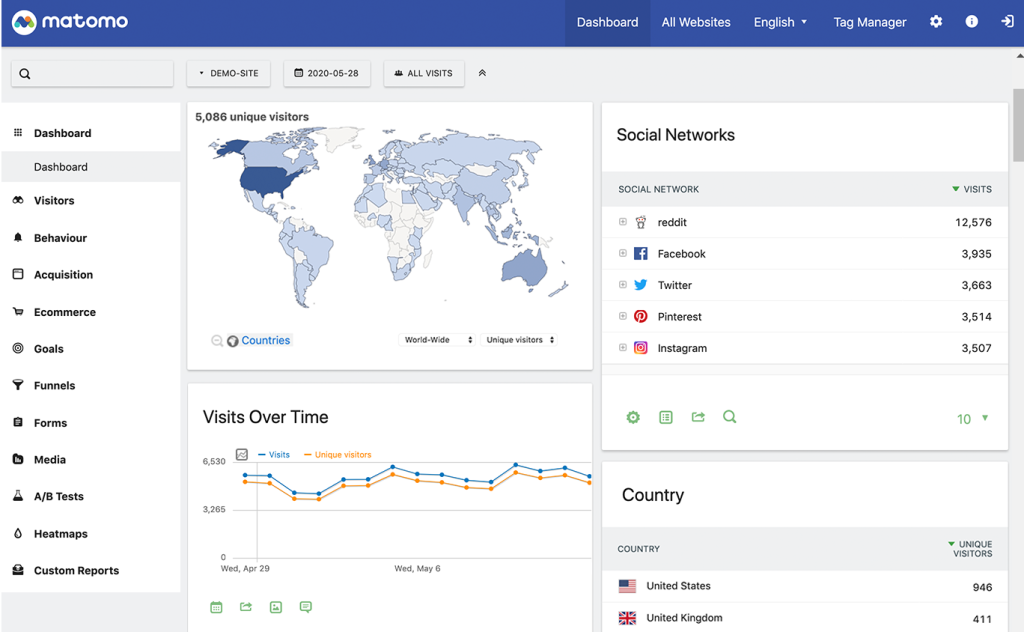
Main dashboard in Matomo
It has cookieless tracking, IP anonymisation and other data minimisation tools that teams can easily configure to align with the GDPR, CCPA, and other data privacy laws.
The platform also offers automated reporting capabilities and advanced analytics tools to dig deeper into user behaviour, such as heatmaps, custom event tracking and session recordings. Unlike Google Analytics and other solutions that sample data, with Matomo, you have 100% of your data, and you know the numbers in your reports always reflect reality.
Standout features include:
- No data sampling: Unlike competitors that use data sampling, Matomo gives you 100% of your data.
- Advanced analytics tools: Use heatmaps, session recordings, A/B testing and multi-channel attribution to understand why customers behave the way they do.
- Customer segmentation tools: Split your audience into cohorts to analyse how different groups interact with your site.
Matomo’s self-hosted deployment option, combined with its free and open-source nature, makes it particularly attractive for businesses that require data sovereignty and control.
Pricing starts from €23 per month for cloud hosting. On-premise hosting is free.
2. Amplitude Analytics
Best for: Product analytics
Amplitude Analytics is an analytics platform for product teams. It provides tools to create announcements, guides and surveys to improve user outcomes and encourage them to reach milestones.
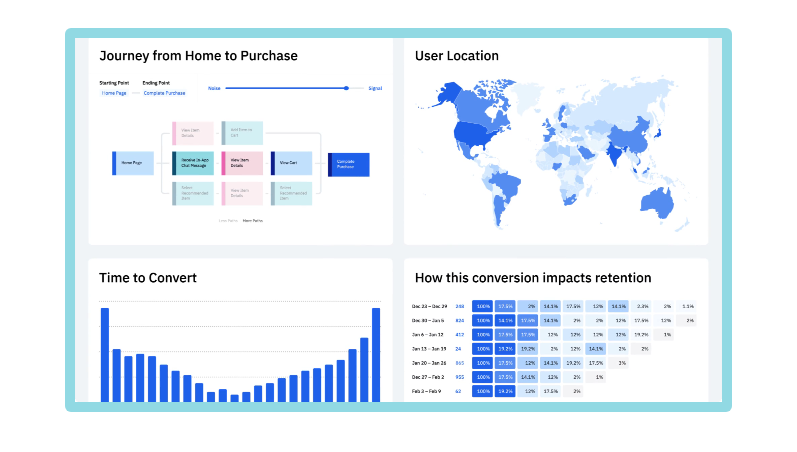
Source: Amplitude
Behaviour-based op-ups, microsurveys and other product announcements can request user feedback at the most opportune times. To prevent too many pop-ups from annoying users, teams can apply prioritisation logic to create built-in guardrails.
Standout features include:
- Self-service analytics: Improves operational efficiency with a no-code/low-code setup that makes insights more accessible and actionable.
- AI-powered assistants: Get immediate answers to product questions.
- Best-practice templates: Choose from a library of pre-built templates for a variety of forms, guides, surveys and checklists.
Pricing starts from $49 per user per month, billed annually. A limited free version is available.
3. Microsoft Power BI
Best for: Enterprise business intelligence
Power BI is an enterprise business intelligence and data visualisation platform.
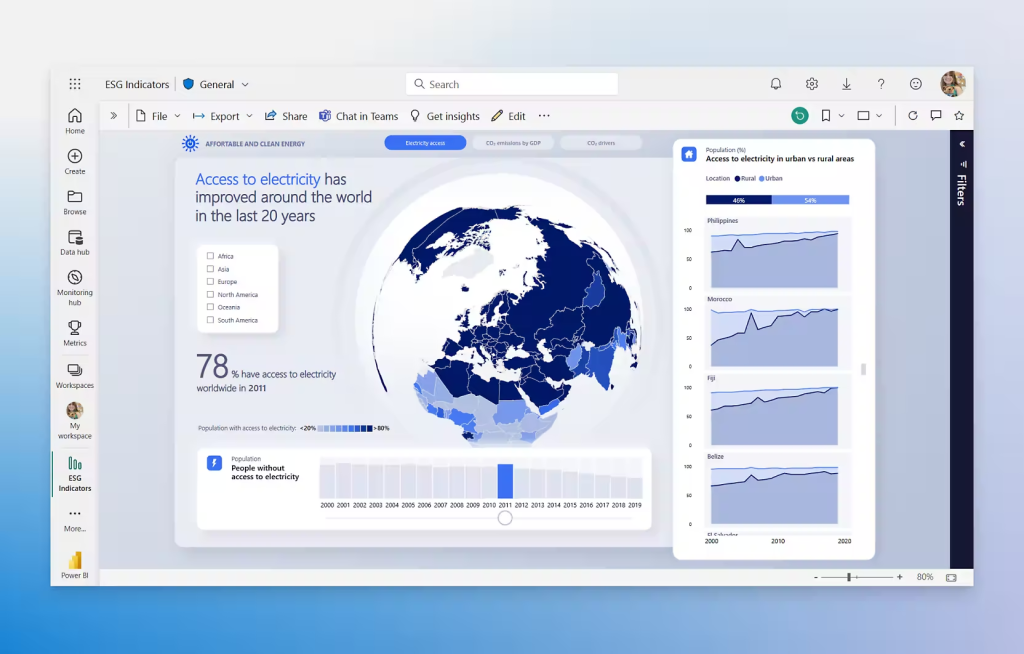
Source: Microsoft
Power BI supports advanced data science and big data workflows. It also offers data mining, data preparation and data warehousing capabilities.
It helps teams consolidate data from different operating units and pull it into a unified interactive dashboard. Its data visualisation tools identify trends in performance and user behaviour that feed future decision-making and product improvements.
Standout features include:
- Near-real time business intelligence: The platform’s AI-powered chatbot lets you ask questions about your data using natural language processing.
- Reporting and visualisation features: Create data visualisations and interpret key trends.
- Strong ecosystem: Integrates naturally with other Microsoft tools like Azure and Excel.
Pricing starts from $14 per user per month, billed annually. A limited free version is available.
4. Tableau
Best for: Data visualisation
Tableau helps teams turn large datasets into interactive visuals to support storytelling and decision making.
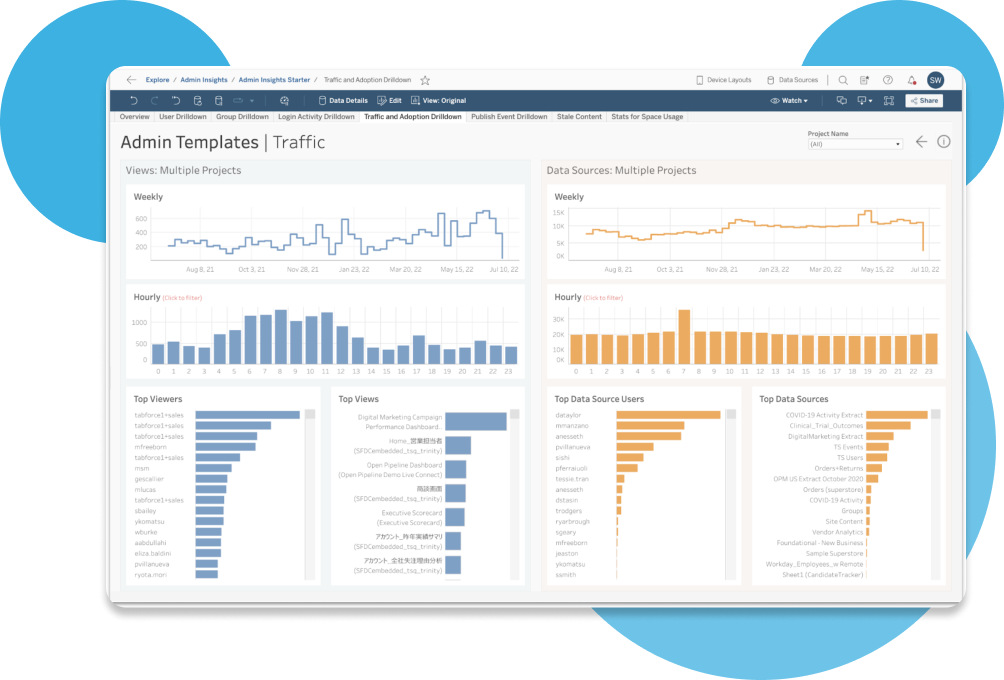
Source: Tableau
It has over 30 pre-built visualisation types that users can easily customise and embed.
Standout features include:
- Drag-and-drop interface: Makes it easy for less technical users to customise and embed reports and visualisations.
- AI suggestions: The platform uses artificial intelligence to recommend the most appropriate visualisation for different types of data.
- Extensive integration library: Connects with most spreadsheets, databases and third-party platforms. Advanced analytics capabilities.
Tableau can also run forecasts and perform other statistical analyses.
Pricing ranges from around $15 to $75 per user, per month, billed annually.
5. Alteryx
Best for: Data preparation and automation
Alteryx is an advanced data analytics, preparation and blending platform. It helps teams clean and integrate data from multiple sources with minimal coding.
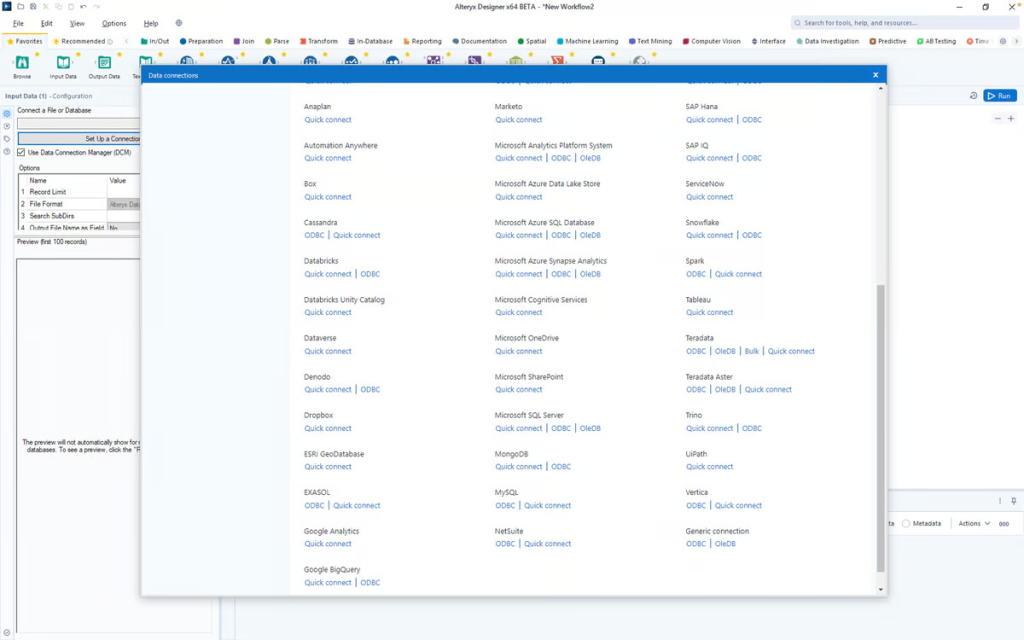
Source: Alteryx
Alteryx uses built-in machine learning and predictive analytics to help teams streamline data ingestion, data preparation, and data transformation processes. Its drag-and-drop interface allows non-technical users to build workflows without the need for a developer.
Standout features include:
- Available integrations: Connects with platforms like Databricks, Google Cloud, Snowflake and Salesforce.
- Low/No-code: Its drag-and-drop interface makes the tool accessible and user-friendly.
- Advanced analytics: Includes predictive, spatial, and text analytics capabilities.
Alteryx is ideal for organisations that need to democratise data access for a wide range of technical and non-technical users. However, small businesses may find the platform too complicated for their needs.
Pricing starts at $250 per user, per month, when billed annually.
How do data analytics platforms work?
While no two data analytics platforms are the same, most use a similar architecture.
- Ingestion layer: This layer automates the collection of data from internal and external sources, including websites, CRMs, apps, and marketing tools.
- Processing layer: Turns all that data into a standardised format for storage and analytics.
- Storage layer: Stores raw and transformed data in the cloud or on an on-premise server.
- Analytics and visualisation layers: Tools for advanced reporting, statistical analysis and intuitive visualisation, like interactive dashboards, heatmaps, charts and predictive analytics models.
- Security and governance layer: Manages access rights, privacy controls and compliance with industry regulations like the GDPR or CCPA.
With the basics covered, let’s discuss how to choose the right one.
How to find the right data analytics tool for you
To create a shortlist of potential analytics tools, start by carefully evaluating your requirements. What do you need the tool to do?
Once you have a complete list of the specific features and capabilities that are critical for your business needs, you can begin to assess each platform’s compatibility.
Here are some key criteria to help guide your assessment.
Data privacy and governance
Data privacy should be a significant concern for any organisation that deals with customer data. IBM’s 2025 Cost of a Data Breach report found that personally identifiable information (PII) is targeted more than any other data category.
It’s important to select a tool that can be easily configured to comply with any applicable privacy laws or standards, such as the GDPR, HIPAA, CCPA, LGPD and PECR.
Look for platforms with data minimisation and anonymisation features that can help teams avoid collecting unnecessary data by anonymising IP addresses and making it easy for visitors to opt out of tracking.
Integration capabilities
Look for integration with your data sources, tools and third-party applications to ensure you can import all the data you need.
Your analytics are only as good as your data sources, after all, so it’s important to connect as many as possible.
For example, marketers will likely need tools that can connect to the following places:
- CMS
- CRMs
- Consent managers
- Ecommerce platforms
- Advertising platforms
- Email marketing tools
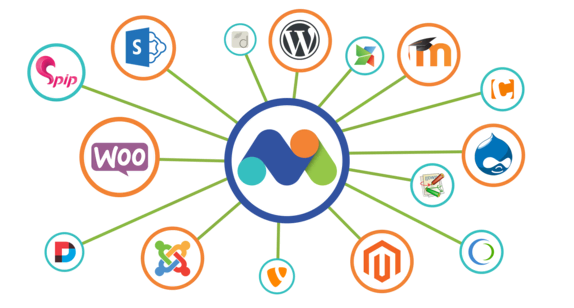
Matomo, for example, natively integrates with a host of CMS, ecommerce, CRMs, and data platforms, including WordPress, Magento, Shopify, and Power BI.
It helps even non-technical users quickly connect with third-party sources and speed up time to insight.
Security and compliance
Opting for a tool with strong security features to keep all of the data you ingest secure and compliant.
Look out for the following security features:
- Data encryption
- User access controls
- Audit logs
For organisations in jurisdictions with strict data residency requirements, such as the EU, Canada, or Australia, look for solutions with on-premises deployment and regional hosting options that align with local data sovereignty laws.
Cost
For many small and medium-sized businesses, the right analytics platform will come down to cost.
When considering a platform, it’s important to examine both upfront license costs and ongoing operational expenses.
Depending on their needs, SMBs may be better off with a smaller, dedicated tool than a big enterprise platform subscription and dozens of features they won’t need or use.
Conclusion
There is no universal “best” solution. It always depends on the organisation’s needs and priorities.
For teams that need privacy-first analytics, Matomo is trusted by over one million websites in 190 countries. Unlike other platforms that sample your data and show you metrics and reports based on estimates, Matomo gives you 100% of your data and more reliable, accurate insights.
To see for yourself, start your 21-day free trial. No credit card required.